Visual Capitalist: Visualizing Global Trade Growth By Product (2019-2023)
Visualizing Global Trade Growth by Product (2019-2023)
Global goods trade fell by 5% in 2023 at a time of rising import restrictions and macroeconomic challenges.
This downturn stands in stark contrast to the strong trade growth seen in 2021 and 2022, fueled by the pandemic recovery, before rising interest rates began to dampen activity. At the same time, geopolitical conflicts and extreme weather events were disrupting supply chains, triggering price spikes in key export commodities.
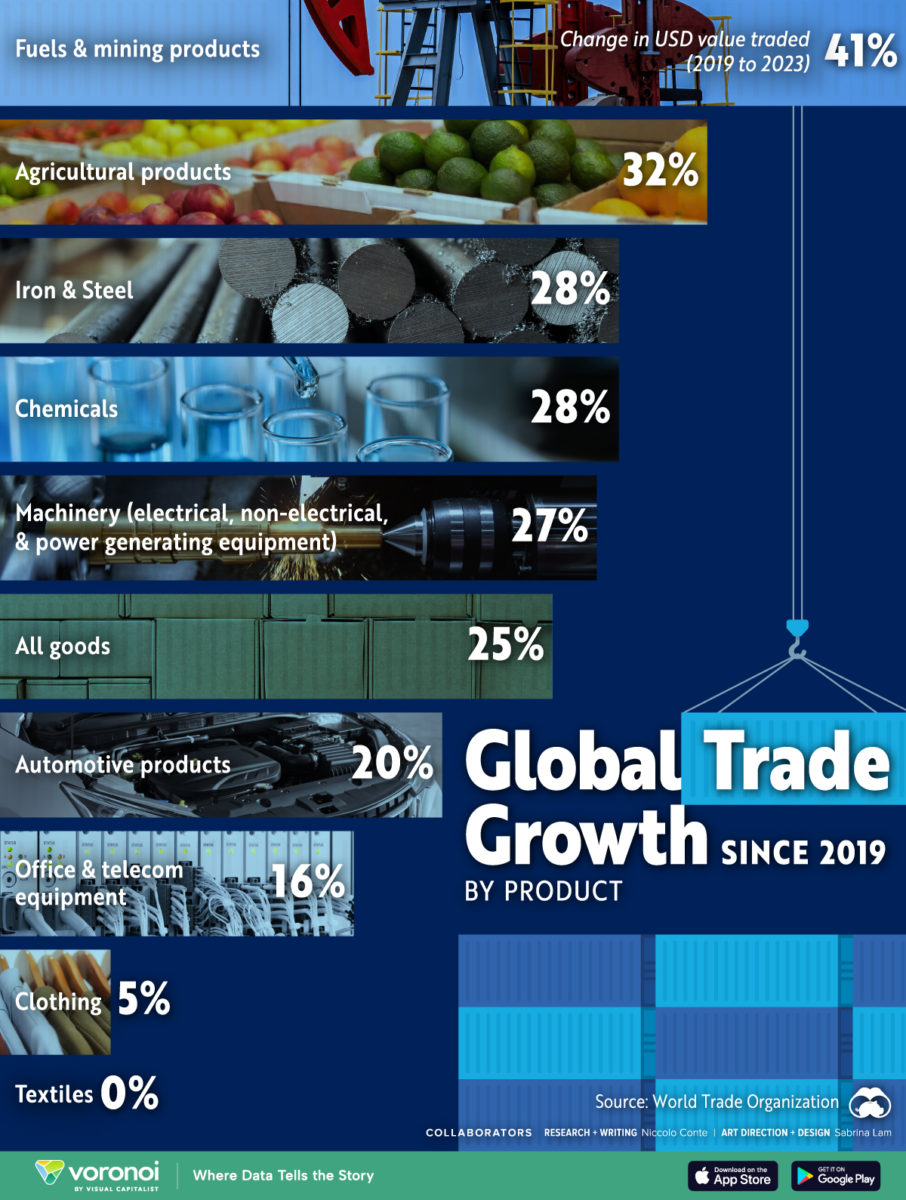
This graphic shows global trade growth by product between 2019 and 2023, based on data from the World Trade Organization.
Fuels and Mining Trade is Up 41% Since 2019
How has global trade changed over the past five years?
Even amid last year’s decline, trade in goods has increased 25% since 2019. In particular, fuels and mining products have risen significantly as the war in Ukraine led energy prices to soar while global fossil fuel consumption continued to rise.
At the same time, demand for rare-earth minerals in the energy transition accelerated, with lithium demand jumping by 30% in 2023 alone.
| Product | % Change in USD Value Traded 2019-2023 |
|---|---|
| ⛽️ Fuels and mining products | 41% |
| 🌾 Agricultural products | 32% |
| 🔩 Iron and Steel | 28% |
| 🧪 Chemicals | 28% |
| ⚙️ Machinery (electrical, non-electrical, and power generating equipment) | 27% |
| 📦 All goods | 25% |
| 🚗 Automotive products | 20% |
| 🖨️ Office and telecommunications equipment | 16% |
| 👕 Clothing | 5% |
| 🧵 Textiles | 0% |
Between 2019 and 2023, agricultural trade jumped 32% as droughts, supply chain disruptions, and conflicts fueled import demand.
Since Russia invaded Ukraine, 48.6 million tons of grain production has been lost, with estimated damage to Ukraine’s agricultural sector topping $80 billion. As the bread basket of Europe, Ukraine exports agricultural products to hundreds of millions of people worldwide.
Adding to this, droughts across sub-Saharan Africa have led food prices to soar amid crop failures and lower agricultural production. The price of cocoa, for instance, nearly doubled between 2019 and 2023 due to drastically reduced crop yields in West Africa. Since then, prices have shot up almost 230%.
On the other hand, global trade in textiles and clothing has barely changed, as inflationary pressures weighed on consumer’s discretionary spending. Since 2019, textiles trade has plateaued while clothing has averaged just 1% in annualized growth.
Looking ahead, global trade growth could see greater friction as Donald Trump returns to office. If a 20% tariff is imposed on global imports along with a 60% tariff on Chinese goods, the average tariff rate would soar to levels not seen since the Great Depression. After the Hawley-Smoot tariffs were imposed, global trade fell by 65% between 1929 and 1934.
Source: https://www.visualcapitalist.com/global-trade-growth-by-product-2019-2023/


