Schwab: What To Expect When Rates Rise
February 16, 2022

With the Federal Reserve poised to begin raising short-term interest rates, investors are looking to a rotation in equity style and sector leadership. Many are looking for opportunities in the value-oriented stocks that can benefit from higher interest rates, such as those in the Financials sector. At the same time, they’re considering the popular belief that higher rates are bad for relatively expensive growth stocks1, many of which are in the Information Technology sector.
In our view, higher rates may be more positive for Financials than they are negative for Information Technology stocks. However, sector winners and losers likely will depend on the pace at which the Fed raises short-term rates, and the impact those higher rates have on the overall stock market, longer-term interest rates and the yield curve.
The Fed is ready to step in
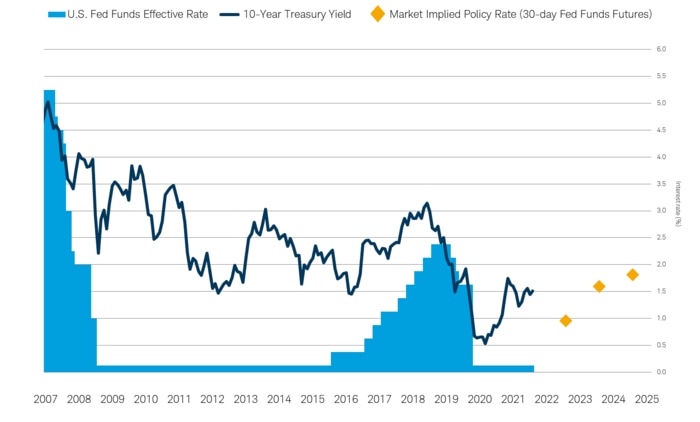
Inflation is at the highest levels since 1982. Ongoing supply shortages, the effects of fiscal and monetary stimulus, a strong job market and higher wages, rising home prices and rents, and the rising price of crude oil are factors that have been stoking inflation. In an effort to keep prices from spiraling higher, the Federal Reserve is likely to begin raising short-term interest rates in the coming months. Currently, markets expect at least four rate hikes in 2022, which would bring the federal funds rate target—that is, the overnight rate that banks charge each other to borrow money—from near zero now to as high as 1% by year-end. Another three hikes are expected by the end of 2023.
The market expects interest rates to rise
Source: Charles Schwab, Bloomberg as of 1/14/2022. Market expectations for the federal funds rate are derived from federal funds futures for December 2022, 2023, 2024. Past performance is no guarantee of future results.
The Fed’s actions only directly affect short-term rates. While longer-term rates are market-driven, they are influenced by some of the same factors that typically spur the Fed to raise short-term rates, primarily inflation. In addition, longer-term yields are affected by expectations for economic growth in the future. If markets believe rate hikes will slow economic growth down the line, longer-term bond yields typically decline, and vice-versa.
In all 12 of the past 14 Fed rate-hike cycles, 10-year Treasury yields were higher in the months preceding the first hike and continued higher for at least two months on average before flattening out. But in most of those cases, longer-term yields resumed their rise well into the tightening cycle—consistent with ongoing economic growth. We think this will be the case this time around, as well.
Higher rates tend to be positive for Financials
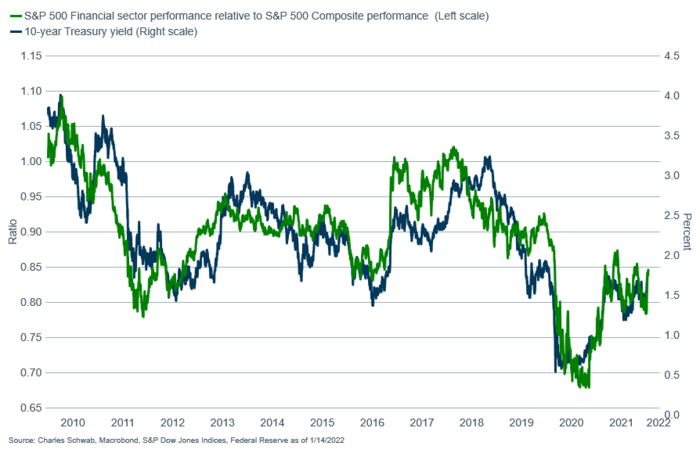
Higher interest rates have obvious positive implications for financial companies. At its most basic level, banks benefit from the spread between their cost of money—e.g., the rate they pay customers for deposits—and the rate at which they lend money out. So it’s not surprising to see the tight relationship between long-term interest rates and the performance of the Financials sector—and this relationship has only strengthened since the onset of the COVID-19 pandemic, when banks’ excess cash balances ballooned. Adding to their attractiveness in a rising-rate environment, valuations for the Financials sector are relatively inexpensive.
Interest rates tend to drive Financials sector performance
Source: Charles Schwab, Bloomberg as of 1/14/2022. “Financials/S&P 500 Index” represents the S&P 500 Financials Index divided by the S&P 500 Index. The “10-year Treasury yield” represents the generic 10-year U.S. Treasury note yield. Past performance is no guarantee of future results.
Higher rates are not necessarily negative for Technology
On the other hand, high valuations in the Technology sector—and growth stocks in general—have been a growing concern. They have climbed to levels not seen since the internet bubble in the late 1990s. One rationale for the lofty valuations has been extremely low interest rates. As their name implies, growth stocks’ earnings (future cash flows) are expected to grow relatively faster than other companies’ over the long term. These increasingly higher future cash flows need to be “discounted” by prevailing interest rates—in a sense comparing what future cash flows are worth today based on the alternative of investing in Treasuries. The higher interest rates go, the lower the value of those future cash flows, all else being equal.
The problem with oversimplifying valuations in this way is that things don’t remain equal—they change all the time. Higher inflation, which can push interest rates up, also likely increases revenues and potentially earnings—resulting in higher future cash flows—particularly if a resourceful company can increase productivity through automation, for example. Some stocks command higher valuations because the companies have shown that they are cutting-edge innovators, so in investors’ eyes a change in interest rates may not be as relevant as the companies’ future potential. The more risk factors that are involved—both positive and negative—the more loosely a company’s valuation is tied to interest rates.
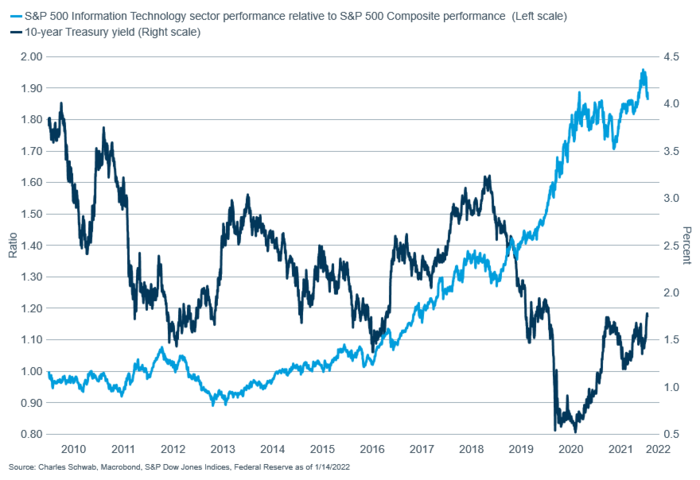
The chart above shows that the relative performance of Financials has historically almost mirrored 10-year Treasury yields. The Information Technology sector’s relative performance has been far different, at least until recently. But even in the past couple of years, the closer relationship has had more to do with the varying performance of Financials and other interest-rate-sensitive cyclical sectors moving the overall market. Statistically speaking, the absolute performance of the Information Technology sector has had an insignificant direct relationship with interest rates.
Rates historically haven’t driven Technology sector performance
Source: Charles Schwab, Bloomberg as of 1/14/2022. “Technology relative performance to S&P 500 Index” represents the S&P 500 Technology Index divided by the S&P 500 Index. The “10-year Treasury yield” represents the generic 10-year U.S. Treasury note yield. Past performance is no guarantee of future results.
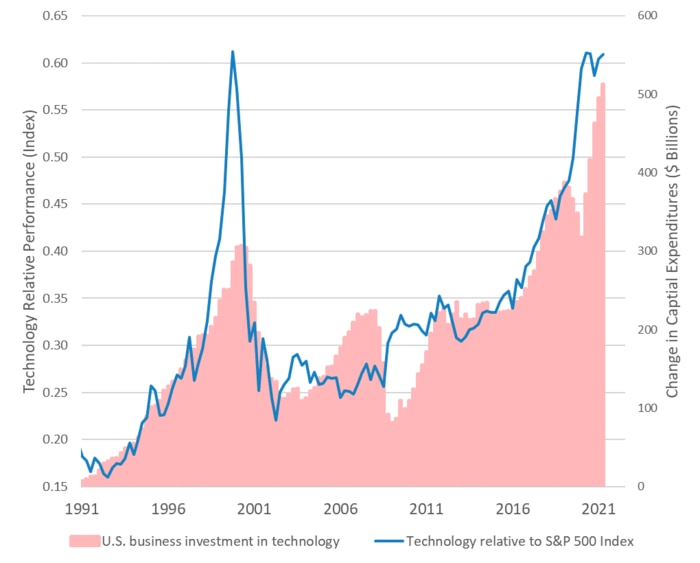
What has been shown to drive the Information Technology sector is business investment in technology. The chart below illustrates the strong relationship between the growth in business investment and the relative performance of the Information Technology sector.
Capital spending tends to drive Technology sector performance
Source: Charles Schwab, Bloomberg. Bureau of Economic Analysis data on Private Fixed Investment Nonresidential Information Processing Equipment, Nonresidential Intellectual Property Products, and Investment Industrial Equipment. The blue line is the difference of the quarterly annualized sum of these data from the 10-year moving average of the sum. The light-red area represents the ratio of price returns of the S&P 500 Technology sector to the S&P 500 Index. Latest business investment data as of 9/30/2021. Past performance is no guarantee of future results.
Indeed, this investment can be impacted to some degree by cyclical changes in the economy—to which interest rates are tied. But many investors in growth stocks play the long game, so these stocks can be less affected by the business cycle than many cyclical stocks are. In the case of Information Technology, there is an ongoing strong long-term tailwind. The sector continues to play a pivotal role in advances in robotics and automation; the transformation toward big data and cloud computing; the software and artificial intelligence that make it work; and smartphones, tablets, and network interfaces to enable us to use it. In the wake of the COVID-19 pandemic, higher wages, labor shortages and increasing input costs may be unleashing an acceleration in investment in productivity-enhancing technologies. The trend toward onshoring manufacturing will likely be another strong tailwind.
Broader market and sector impacts from rising rates
Interest rates are one of the most important elements of the overall economy, and therefore have a wide-ranging impact—either directly or indirectly—on all sectors to varying degrees, as well as the stock market in general.
One of the difficulties in trying to determine what impact the Fed rate hikes may have is due to the relatively few historical examples we have to work with. Even those have a lot of variability from cycle to cycle. That said, we can use what we have to provide a historical context, at minimum.
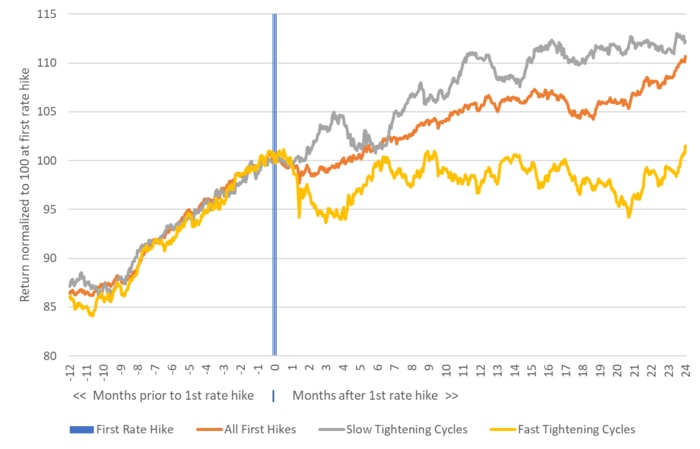
In terms of the overall market, on average stocks (as reflected by the S&P 500 index) historically tended to have continued gains after initial rate hikes, as you can see in the chart below. But when Fed tightening cycles are separated into “fast” and “slow” varieties, another pattern emerged. When the Fed’s tightening cycles were slow—that is, it wasn’t raising rates at every consecutive Federal Open Market Committee (FOMC) policymaking meeting—the stock market tended to do well in following months. When the pace was fast—that is, rates were raised at nearly every FOMC meeting—stocks historically struggled. At both speeds, however, higher volatility ensued.
The S&P 500 has risen faster when the Fed hiked slowly (1946-present)
Source: Charles Schwab, Ned David Research (with permission) as of 1/11/2022. The chart shows S&P 500 Index performance around the start of the last 17 Fed tightening cycles (beginning 4/25/1946, 4/15/1955, 9/12/1958, 7/17/1963, 11/20/1967, 12/19/1968, 7/16/1971, 1/15/1973, 8/31/1977, 9/26/1980, 4/9/1984, 9/4/1987, 2/4/1994, 3/25/1997, 6/30/1999, 6/30/2004, and 12/16/2015). A fast cycle is one in which the FOMC raises rates at almost every meeting, on average. A slow cycle is one in which the FOMC waits at least one meeting in between hikes, on average. Past performance is no guarantee of future results.
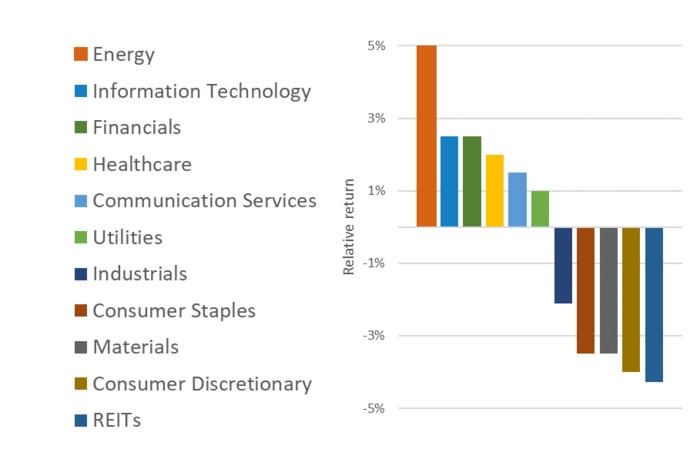
The higher volatility may have been due to increased investor uncertainty, particularly as most tightening cycles were followed by recessions—although usually not for another three-plus years, on average. At the sector level, the chart below reflects the average performance for each sector in the 12 months after the initial rate increases in the past five rate-hike cycles.
Sector performance after first rate hikes (1994-present)
Source: Charles Schwab, Ned Davis Research. Median S&P 500 sector performance relative to the S&P 500 Index 12 months after the first rate hike of the federal funds target by the Federal Open Market Committee over the past five rate hike cycles (beginning 2/4/1994, 3/25/1997, 6/30/1999, 6/30/2004, and 12/16/2015). Real Estate (“REITs”) is represented by the FTSE NAREIT Total Return Index, as Real Estate did not become a separate Global Industry Classification Standard (GICS®) sector until 2016. Data as of 1/3/2022. Past performance is no guarantee of future results.
In general:
• Information Technology benefits from being a high-growth sector with only modest cyclical exposure and no statistically significant direct exposure to interest rates.
• Financials tend to benefit from rising interest rates.
• Higher oil prices—which are typically part of the rise in inflation that the Fed is trying to quell by raising rates—support the Energy sector.
• Heightened volatility and investor expectations that we are entering the latter stages of the business cycle begin to support some of the more traditionally defensive sectors, like Health Care, Communication Services, and Utilities. At the same time, this pressures some of the more cyclical sectors like Consumer Discretionary, Materials, and Industrials.
• Real Estate, which consists primarily of real estate investment trusts (REITs) is a mixed bag. REITs are a hybrid: They tend to benefit from economic growth, which supports rent collections and property prices—but because most REITs borrow heavily, they are very negatively affected by rising interest rates.
There are even fewer historical examples for sector performance around rate hikes—because Global Industry Classification Standard (GICS) categorization only dates back to 1989—as such, the chart doesn’t separate the fast and slow tightening cycles. But it would make sense to expect more defensive leadership in a fast-tightening cycle than in a slow-tightening cycle.
What will this cycle be like?
Based on the current market expectations for the Fed rate hikes, the coming cycle could fall into the slow tightening cycle camp. If history is a guide, this could result in both relative and absolute gains in Information Technology and Financials. However, the recent trend in expectations has been for more rate hikes—not fewer—which could push it into the “fast” camp if that continues.
As we know, this business cycle—driven to a large extent by the COVID-19 pandemic—has been like no other in the modern era, and the Fed’s tightening cycle may not be either. For example, the Fed may reduce the size of its balance sheet (also called quantitative tightening) sooner in this rate hike cycle than it did in the last one—though it’s notable that Information Technology continued to outperform during that period. There are many, many potential scenarios based on the evolution of COVID-19, geopolitics, myriad economic trends around the globe, and the markets. There’s no knowing whether investors will collectively buy into the narrative of “higher rates are bad for growth stocks,” despite some of the evidence otherwise.
We think rates are likely to go modestly higher, likely supporting Financials’ performance. At the same time, we expect strong earnings growth—both present and future—to be a tailwind for Information Technology stocks. But it’s likely to be a bumpy ride as the Fed expands its mission to rein in inflation, so we’re maintaining a neutral rating on both sectors for now. In this environment, if you do make a sector tilts in your portfolio, we advise keeping them small.
1 “Growth” stocks are those of companies whose earnings are expected to rise faster than average in the future, for example because the company has unique product lines or access to innovative technologies. “Value” stocks are those considered to be trading below what they are really worth.
What do the ratings mean?
The sectors we analyze are from the widely recognized Global Industry Classification Standard (GICS®) groupings. After a review of risks and opportunities, we give each stock sector one of the following ratings:
- Outperform: likely to perform better than the broader stock market*
- Underperform: likely to perform worse than the broader stock market*
- Neutral: no current view on likely relative performance
* As represented by the S&P 500 index
Want to learn more about a specific sector? Click on a link below for more information or visit Schwab Sector Views to see how they compare. Schwab clients can log in to see our top-rated stocks in each sector.
| Communication Services | Financials | Materials |
| Consumer Discretionary | Health Care | Real Estate |
| Consumer Staples | Industrials | Utilities |
| Energy | Information Technology |
How should I use Schwab Sector Views?
Investors should generally be well-diversified across all stock market sectors. You can use the Standard & Poor’s 500® Index allocations to each sector, listed in the chart above, as a guideline.
Investors who want to make tactical shifts in their portfolios can use Schwab Sector Views’ outperform, underperform and neutral ratings as a resource. These ratings can be helpful in evaluating and monitoring the domestic equity portion of your portfolio.
Schwab Sector Views can also be useful in identifying stocks by sector for potential purchase or sale. Clients can use the Portfolio Checkup tool to help ascertain and manage sector allocations. When it’s time to make adjustments, Schwab clients can use the Stock Screener or Mutual Fund Screener to help identify buy or sell candidates in particular sectors. Schwab Equity Ratings also can provide a fact-based and powerful approach for helping you select and monitor stocks.
Source: https://www.schwab.com/resource-center/insights/content/sector-views


