Schwab: Have Stocks Already Priced In Economic Boom?
May 7, 2021
Key Points
- Economic and earnings data are in boom territory, with more momentum likely near-term.
- But the stock market tends to sniff out inflection points in economic data; so keep a close eye on growth rates, and the possibility of a peak in this year’s second quarter.
- Low-quality momentum-based trading has given way to more fundamentals-driven leadership as stocks discount a move from early cycle to mid-to-late-cycle economic conditions.
With green all around us again now that winter is over (I know, in Naples FL where I live it’s always green); vaccines and herd immunity continuing to bring COVID cases down; and the economic reopening kicking into higher gear; the data is starting to shine. Across economic metrics—from gross domestic product (GDP) to retail sales to job growth—boom conditions are evident. So why have U.S. stocks had a fairly muted response (today’s strength notwithstanding); with range-bound trading (and two pullbacks) since mid-April?
Could market “disconnect” again from economy?
For the first six months of the stock market’s recovery off the March 23, 2020 low I was peppered with questions about the perceived disconnect between the stock market and the economy. This was particularly elevated by early-September 2020—at which point the S&P 500 and NASDAQ were trading at new all-time highs, while the economy was still in dire straits. My response at the time was to point out that if you peeled back the market’s onion just one layer, you would have seen that market leadership was incredibly narrow.
Year-to-date last year, through September 2, 2020, the “big 5” largest stocks in the S&P 500 (Apple, Microsoft, Amazon, Google and Facebook) were up 65%; while the remaining 495 stocks in the index were up only 3%. At that same time, nearly 40% of the S&P 500’s stocks were still in bear markets (down at least 20% from their 52-week highs). Frankly, that was reflective of an economy with a very small subset of winners, and a huge subset of losers. Fast forward to today, and I’m getting the question again; but with a mirror image characteristic, given economic and earnings data have been booming, and the stock market seemingly lagging a bit.
Leading edge
The key to understanding the relationship between economic data and the stock market is understanding the relationship among leading, coincident and lagging indicators. As most investors know, the stock market is a leading indicator; and as such, tends to trend with other leading indicators like unemployment claims, the yield curve, the average workweek, among others. Some of the more popular economic indicators—like payroll growth and retail sales—are coincident indicators, while the unemployment rate is one of the most lagging of economic indicators. Even GDP is lagging in nature given that the first read for each quarter comes a full month after the quarter ends—and with two subsequent revisions coming even later.
Take a look at the aforementioned retail sales and payrolls in terms of not only the recent improvement off the pandemic lows, but the expected trajectory over the next month. Retail sales is one of the only economic indicators to have experienced a true V-shaped recovery; and with the expected surge to come when the April data is reported, it’s truly gone parabolic. The same is possible for job growth; with payrolls set to rocket higher as soon as this coming Friday’s nonfarm payrolls report.
Retail Sales’ Parabolic Recovery
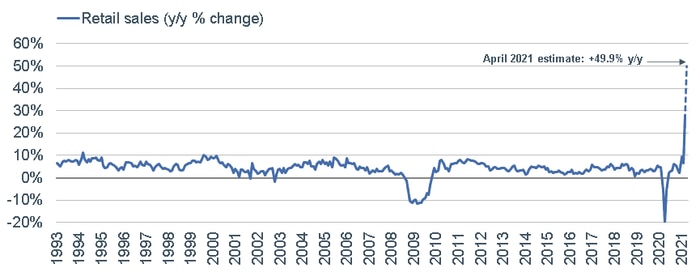
Source: Charles Schwab, Bloomberg, as of 3/31/2021. April 2021 estimate is based on Bloomberg consensus survey of economists.
Payrolls’ About to Go Parabolic?
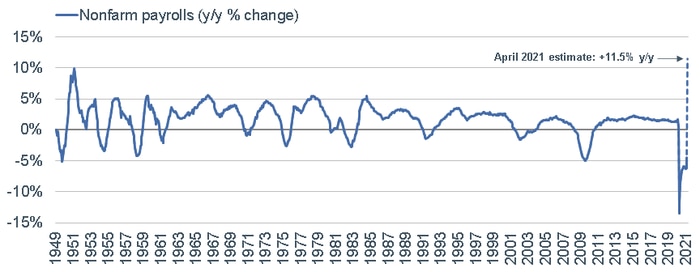
Source: Charles Schwab, Bureau of Labor Statistics, Bloomberg, as of 3/31/2021. April 2021 estimate is based on Bloomberg consensus survey of economists.
Better or worse matters more than good or bad
Both retail sales and payrolls are coincident indicators. Conversely, the stock market as a leading indicator tends to rebound well ahead of coincident economic data moving to robust readings. In addition, as I’ve always said, when it comes to the stock market’s perspective on economic data, better or worse matters more than good or bad. It’s human nature for us to think about economic data in good vs. bad or strong vs. weak terms; but stocks are generally more tuned into economic data’s trend and rate of change vs. level.
Elevated sentiment
Over the past few months, I’ve noted that one of the greatest risks for the stock market has been bred from its success over the past 14 months—which is elevated optimistic sentiment. In and of itself, frothy sentiment isn’t an immediate warning sign for stocks. Typically, a negative catalyst is needed to unleash the contrarian move by stocks. This is what happened last year.
By the end of January 2020, investor sentiment was also becoming overly optimistic, and even frothy. Then we got the mother-of-all negative catalysts in the name of COVID-19. Could there be a catalyst on the horizon that might be at odds with conventional wisdom? As appropriate as it is to cheer stronger economic growth—especially if it brings with it more dramatic improvement in labor market conditions and a continued fall in the unemployment rate—too much of a good thing brings its own risk.
The stock market has an uncanny ability to sniff out inflection points in the economy (either when growth is peaking, or a contraction is troughing). I do believe the leadership shift the market has displayed since early-to-mid March suggests stocks have shifted from an “early cycle” bias, toward a “mid-to-late-cycle” bias. It’s not uncommon for leadership to skew lower-quality, where economic leverage is typically higher, when the market starts pricing in an economic surge. But low-quality leadership tends to be fairly short-lived (as was the case in January and February this year); and ultimately gives way to a higher quality, more fundamentally-based leadership bias. We believe we are firmly in a fundamentals-driven phase today.
Be careful what you wish for
We can look at a cross-section of economic data, with long histories, to see how the stock market has behaved in various zones. Our long-time friends at Ned Davis Research have always had some of the best historical data on the relationship between economic data ranges and stock market performance.
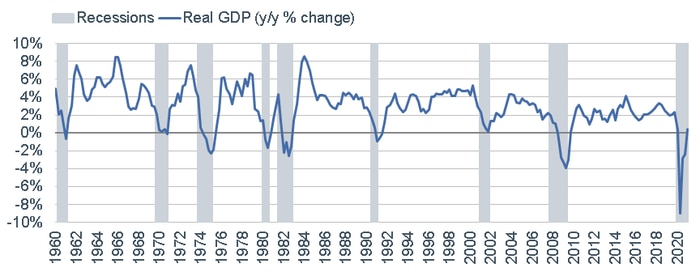
First up is the broadest reading on the economy, which is GDP. As you can see, using three broad ranges for GDP growth historically, the lowest range (when the economy is barely growing and/or in recession) has actually been accompanied by the highest (by far) annualized stock market performance.
As you can see in the chart, GDP is only slightly back into positive territory on a year-over-year basis. However, with the strong growth expected in the second quarter, it could quickly move into the highest zone—during which stocks have had a negative annualized return historically.
GDP Ranges and Market Returns

Source: Charles Schwab, Bloomberg, ©Copyright 2021 Ned Davis Research, Inc. Further distribution prohibited without prior permission. All Rights Reserved. See NDR Disclaimer at www.ndr.com/copyright.html. For data vendor disclaimers refer to www.ndr.com/vendorinfo/, as of 3/31/2021. Indexes are unmanaged, do not incur management fees, costs and expenses and cannot be invested in directly. Past performance is no guarantee of future results.
One of the most highly-watched economic reports comes each month from the Institute for Supply Management (ISM). ISM is survey-based, real-time data measuring activity in both the manufacturing and services segments of the economy. The ISM Manufacturing (ISM-M) Index is a key leading indicator.
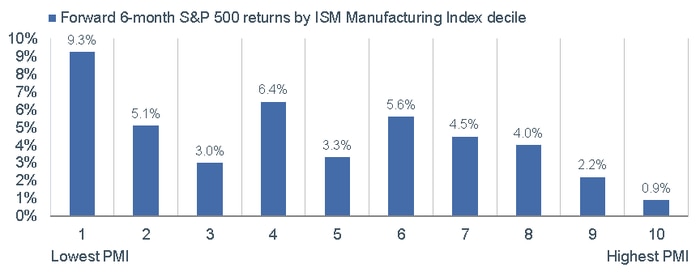
As you can see in the first chart below, the ISM-M has been on a tear—well above the 50 expansion/contraction line, and near a record high. That puts it in the top decile of historic readings; which on the surface would seem like a wonderful backdrop for the market. However, as you can see in the second chart below, too much of a good thing has historically been an issue for stocks. Also, for what it’s worth, today’s release of the ISM-M was a disappointment relative to expectations; with a downtick to 60.7 from its recent high of 64.7.
ISM-M Coming Off Boil?
Source: Charles Schwab, Bloomberg, Institute for Supply Management (ISM), as of 4/30/2021.
ISM-M Deciles and Market Returns

Source: Charles Schwab, Bloomberg, Institute for Supply Management (ISM), 1948-4/30/2021. Indexes are unmanaged, do not incur management fees, costs and expenses and cannot be invested in directly. Past performance is no guarantee of future results.
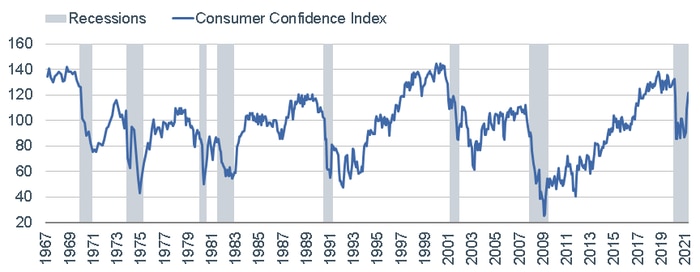
The expectations component of consumer confidence is also a leading indicator. As you can see in the chart below, consumer confidence overall has finally started to rebound from its lengthy span in the pandemic doldrums (although it never plunged to typical-recession territory thanks to massive fiscal relief). However, as you can see in the accompanying table below, confidence is now in the zone in which the stock market has had fairly anemic annualized returns.
Consumer Confidence Ranges and Market Returns

Source: Charles Schwab, Bloomberg, ©Copyright 2021 Ned Davis Research, Inc. Further distribution prohibited without prior permission. All Rights Reserved. See NDR Disclaimer at www.ndr.com/copyright.html. For data vendor disclaimers refer to www.ndr.com/vendorinfo/, as of 4/30/2021. Indexes are unmanaged, do not incur management fees, costs and expenses and cannot be invested in directly. Past performance is no guarantee of future results.
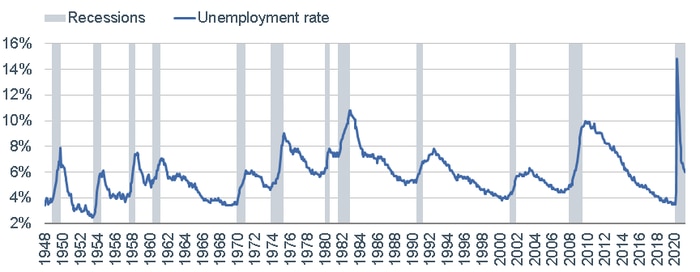
Let’s look at one of the most lagging of all economic indicators now—the unemployment rate. As you can see in the chart below, it has plunged from near-15% during the worst phase of the pandemic, to 6% today. It is expected to decline further when we get the April jobs report this coming Friday. However, as you can see in the table below, in perfect keeping with stocks being a discounting mechanism and a leading indicator, as the unemployment rate moves from its highest-to-lowest zones, annualized stock market gains have deteriorated. By the time the lagging unemployment rate has made its major move from a recession high to a recovery low, the stock market has historically already priced in that improvement.
Unemployment Ranges and Market Returns

Source: Charles Schwab, Bloomberg, Bureau of Labor Statistics, ©Copyright 2021 Ned Davis Research, Inc. Further distribution prohibited without prior permission. All Rights Reserved. See NDR Disclaimer at www.ndr.com/copyright.html. For data vendor disclaimers refer to www.ndr.com/vendorinfo/, as of 3/31/2021. Indexes are unmanaged, do not incur management fees, costs and expenses and cannot be invested in directly. Past performance is no guarantee of future results.
Earnings growth inflection on horizon?
Let’s shift gears and conclude with some data that is more directly tied to the stock market. Earnings growth is obviously tied to stock market performance; but with time lags that are less well-understood. We are about half-way through first quarter S&P 500 earnings season and so far, the results have been exceptionally strong.
At more than 87%, the “beat rate” (percentage of S&P 500 companies beating estimates) is a record-high; and well above the post-1994 average of 65%. In aggregate, companies are reporting earnings about 23% higher than estimates, which compares to a post-1994 average of less than 4%. Investors have mostly yawned at the impressive growth. For companies beating earnings estimates, the excess stock price return vs. the S&P 500 (on the day of the reports) has been -0.03%; while for those missing estimates, the average has been even worse at -3.1%. The flat performance for stocks of companies beating estimates suggests that most of the good news was expected.
Relative to last year’s second quarter plunge of nearly -31% year-over-year, S&P 500 earnings are expected to be up more than 46% in this year’s first quarter and then a whopping 60% in the second quarter. That is expected to be the inflection point in terms of the year-over-year growth rate.
As you can see in the table below, the stock market is a discounter of earnings growth. That is why the “forward” P/E ratio (based on expected next 12-months of earnings) is more widely-watched than the “trailing” P/E ratio. Yes, stocks have had their worst performance when earnings are plunging during recessions (-25% or worse). However, the best market performance has actually come in the zone just above that—when earnings are still down between -25% and -10%—with a whopping near-27% annualized gain. (We did some additional analysis around this zone and found, unsurprisingly, that median gains are higher when earnings are moving up into that zone from below; vs. moving down into that zone from above.) As you can also see, by the time earnings have accelerated to their highest zone (above 20%), the stock market has typically already priced in most of those gains; with a low annualized return of only 2.4%.

Source: Charles Schwab, ©Copyright 2021 Ned Davis Research, Inc. Further distribution prohibited without prior permission. All Rights Reserved. See NDR Disclaimer at www.ndr.com/copyright.html. For data vendor disclaimers refer to www.ndr.com/vendorinfo/, as of 3/31/2021. Based on trailing 12-month earnings in accordance with GAAP (generally accepted accounting principles.). Indexes are unmanaged, do not incur management fees, costs and expenses and cannot be invested in directly. Past performance is no guarantee of future results.
Households’ financial assets exposure
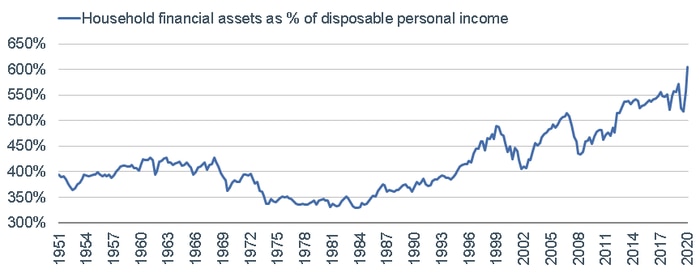
An implication of the market’s success is the historically-elevated exposure by U.S. households to financial assets relative to disposable personal income. As you can see in the chart below, the ratio has surged to more than 600%, which is an all-time high in the post-1951 history of the data. What should not come as a surprise is that in the highest zone of the ratio historically, the stock market has had lower annualized returns than when financial assets’ exposure is in the lower zones; as you can see in the table below. What the table also shows is that economic growth—across metrics of nominal GDP, corporate profits, payroll growth and real non-residential investment (capex)—has also been lower when exposure to financial assets are higher.
Financial Assets Ranges and Market/Economic Performance
Source: Charles Schwab, Bloomberg, ©Copyright 2021 Ned Davis Research, Inc. Further distribution prohibited without prior permission. All Rights Reserved. See NDR Disclaimer at www.ndr.com/copyright.html. For data vendor disclaimers refer to www.ndr.com/vendorinfo/, as of 12/31/2020. Indexes are unmanaged, do not incur management fees, costs and expenses and cannot be invested in directly. Past performance is no guarantee of future results.
In sum
What is the primary risk associated with the boom economic conditions we continue to expect for the next few months? Clearly as the data above show, the market tends to discount a surge in economic activity; with waning performance after growth rates peak. Although I don’t fear peak growth in level terms; there is a strong case that peak growth rates will occur in this year’s second quarter—clearly courtesy of “base effects” related to last year’s epic plunge across nearly all economic and earnings metrics.
Fed policy is another potential risk. I learned a valuable lesson about “don’t fight the Fed” from my first boss in this business—the late-great Marty Zweig, for whom I worked from 1986-1999—who actually first coined that phrase. The Federal Reserve—and its chair Jerome Powell specifically—are doing everything they can to run both the economy (and inflation) “hot” for a while. Regarding inflation, as it heats up, expect Powell, et. al., to continuously reiterate the view that it’s “transitory;” with too much labor market slack near-term to ignite the kind of systemic, wage-price spiral style of inflation of the 1970s. But markets aren’t outlawed from volatility associated with concerns that the Fed may get behind the curve.
Optimism is extremely elevated—certainly justified by stock market behavior over the past year, as well as recent economic releases. But some curbing of enthusiasm may be warranted given the history of the stock market as an uncanny “sniffer-outer” of economic inflection points. This is not a time for FOMO-driven investment decision making; but instead of adherence to the tried-and-true disciplines of diversification (across and within asset classes), periodic rebalancing and fundamentals-based stock picking (for those investors who do that directly).


