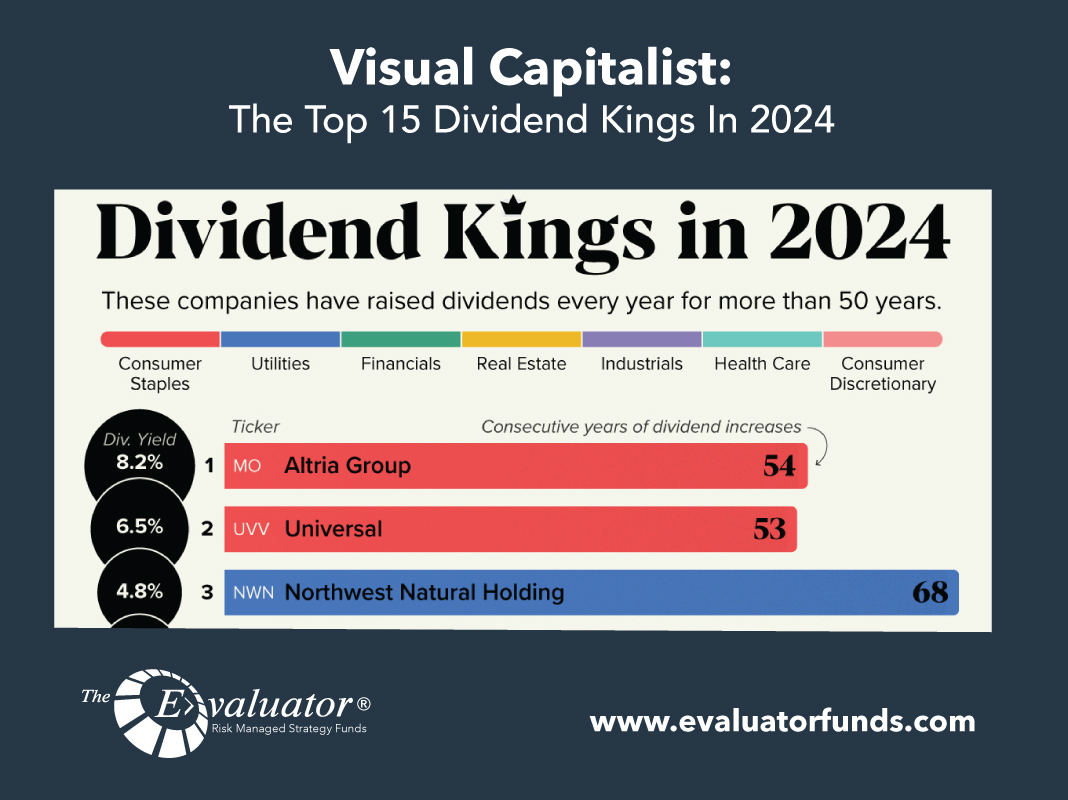
Visual Capitalist: The Top 15 Dividend Kings In 2024
Ranked: The Top 15 Dividend Kings in 2024 Dividend stocks have historically shown growth, even during periods of recession. In this graphic, we showcase the top 15 ‘Dividend Kings’ in 2024, as identified […]
John Hancock: Weekly Market Recap Week Ended October 25
Top-heavy earnings Near the midpoint of earnings season, a handful of U.S. mega-cap technology stocks are expected to continue generating a disproportionate share of overall earnings growth. Analysts expected that the group of stocks known as the Magnificent Seven will generate average third-quarter growth of 18.1%, according to FactSet. In contrast, the other 493 companies […]
PGIM: Fixed Income 4Q 2024 Outlook
Each quarter, PGIM Fixed Income publishes an outlook describing its views on the economy, as well as its expectations for sectors within fixed income markets. Here’s where PGIM Fixed Income sees value (and where it doesn’t) in the coming quarter. AT A GLANCE – PGIM FIXED INCOME SECTOR VIEWS: SECTOR OUTLOOK DEVELOPED MARKET SOVEREIGN RATES […]
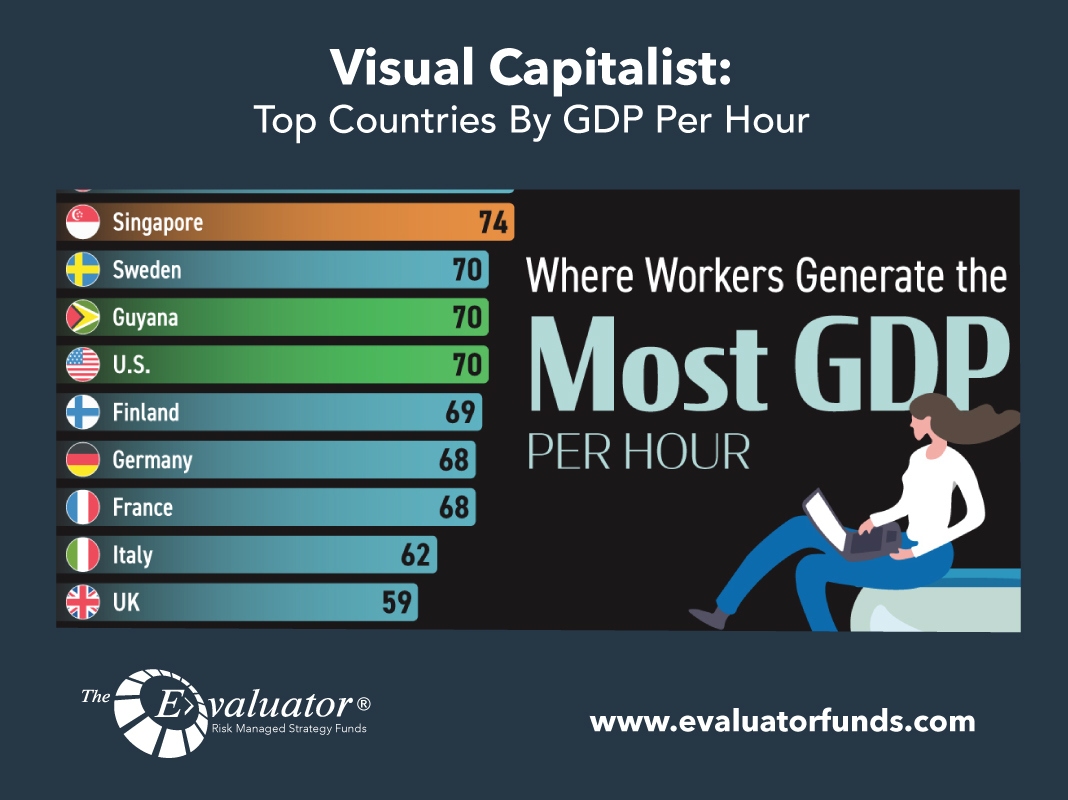
Visual Capitalist: Top Countries By GDP Per Hour
Ranked: Top Countries by GDP per Hour This chart ranks countries by GDP per hour worked, or their labor productivity. Data is sourced from the International Labour Organization, as of 2023. Labor productivity measures the amount of output (GDP) produced per unit of labor (hours worked) over a specific time period. It’s measured […]
LPL: Weekly Market Performance October 18, 2024
Additional content provided by Brian Booe, Associate Analyst, Research. Major indexes recorded yet another weekly advance, overcoming choppy tech trading and a mid-week rotation which benefited economically sensitive sectors and small cap stocks. Additionally, after starting on a positive note last Friday, third quarter earnings season rolled on with 43 stocks from the S&P 500 […]
Eaton Vance: The BEAT October 2024
Key Themes for October Crossing Peak Uncertainty October represents peak uncertainty. Markets have been wrestling with the start of Fed rate cuts and the U.S. election outcomes of both the president and the makeup of Congress. This uncertainty has led to volatility and wild swings in asset prices. But by early November we will know […]
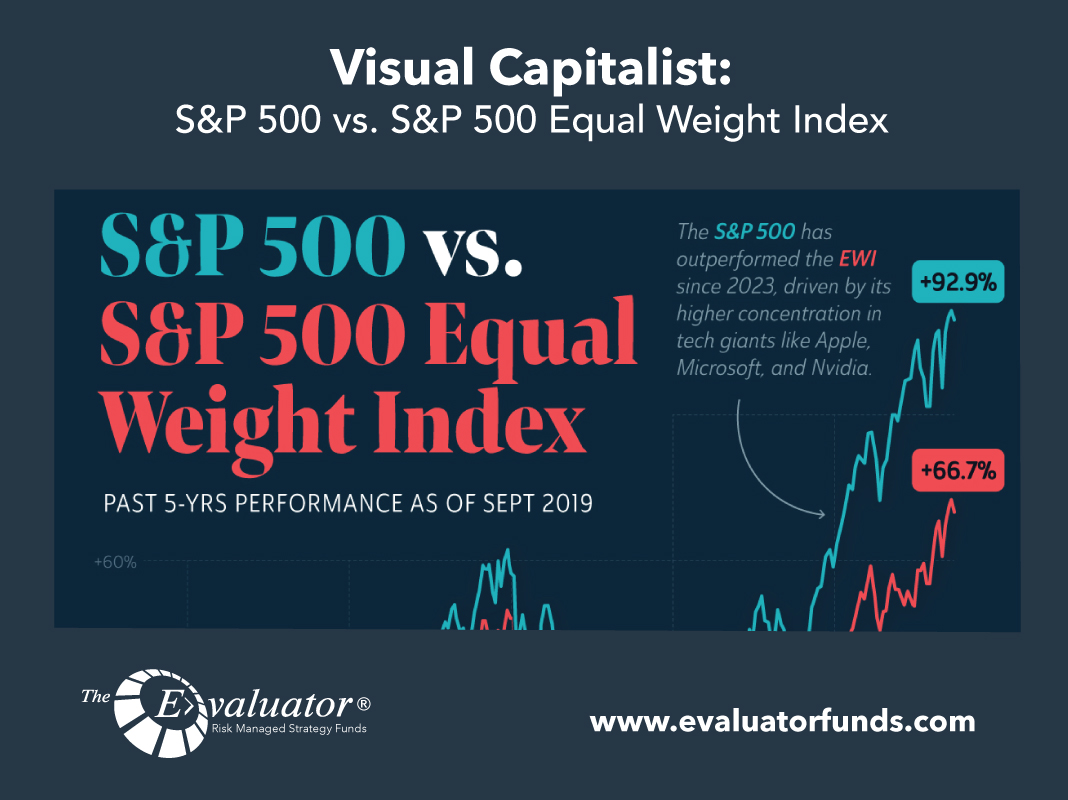
Visual Capitalist: S&P 500 vs. S&P 500 Equal Weight Index
Charted: S&P 500 vs S&P 500 Equal Weight Index In this graphic, we compare the performance of the S&P 500 and the S&P 500 Equal Weight Index (EWI) since Sept. 2019. The regular S&P 500 is a market-cap weighted index, which means that its constituents are weighted by their market capitalization. As a result, larger […]
John Hancock: Weekly Market Recap Week Ended October 11
Rising yields The yield of the 10-year U.S. Treasury note climbed for the fourth week in a row as a monthly report on inflation prompted investors to dial back expectations for the pace of further interest-rate cuts. The yield of the 10-year note closed at 4.08% on Friday—up from 3.98% at the end of the […]
Lord Abbett: Five Quick Points On The Fed’s Rate-Cut Decision
Five Quick Points on the Fed’s Rate-Cut Decision A brief outline of the policy and investment implications of the September 17–18 FOMC meeting. Download the PDF version of this insight The Federal Open Market Committee (FOMC), the policy-setting arm of the U.S. Federal Reserve (Fed), cut the target federal funds rate by 50 basis […]
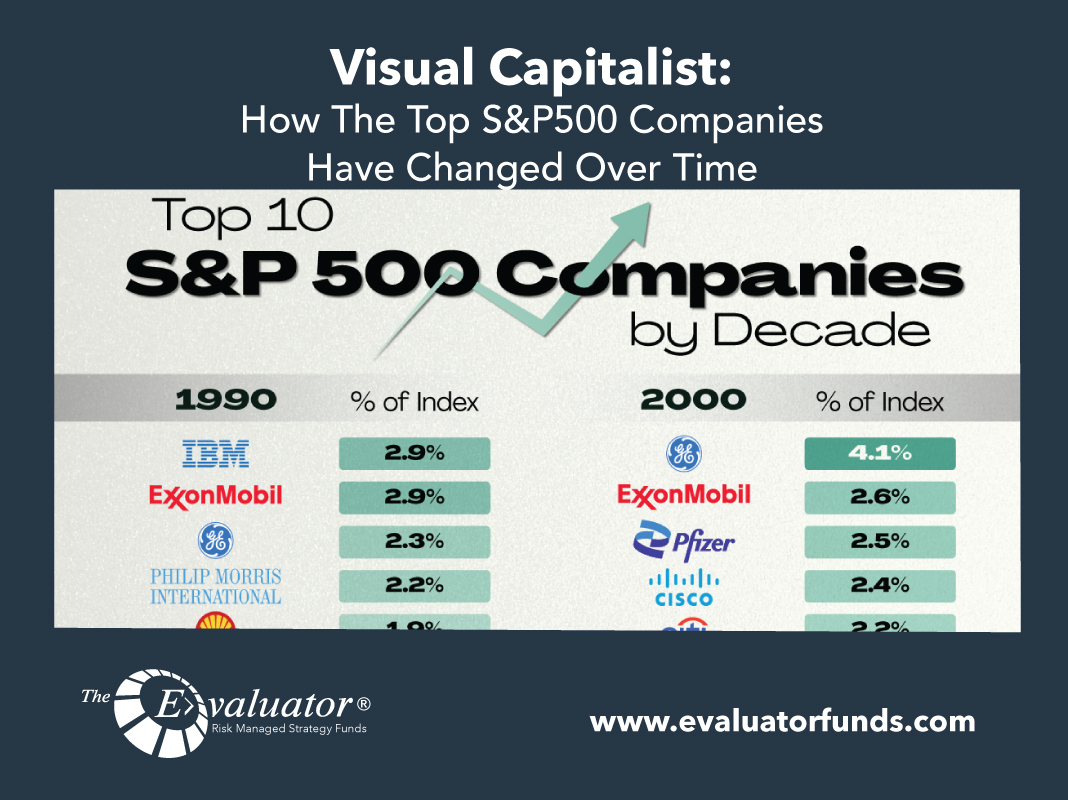
Visual Capitalist: How The Top S&P500 Companies Have Changed Over Time
See How the Top S&P 500 Companies Have Changed Over Time Launched in 1957, the S&P 500 is a benchmark index that tracks the performance of […]


