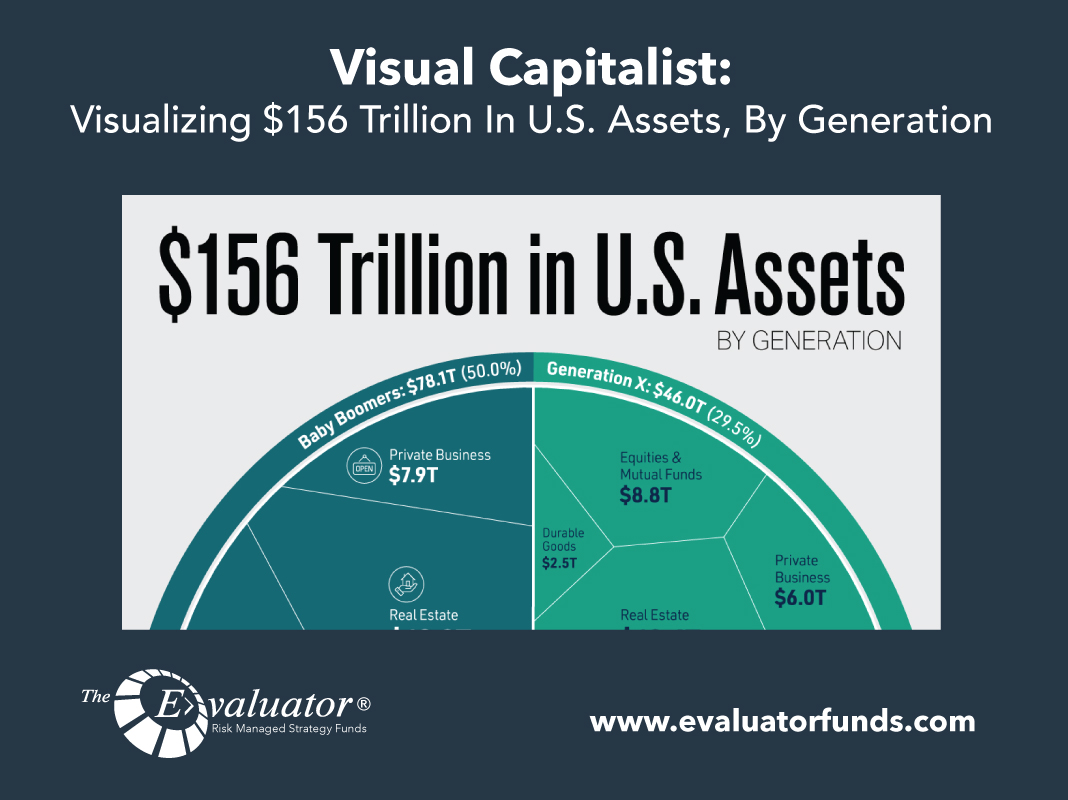
Visual Capitalist: Visualizing $156 Trillion In U.S. Assets, By Generation
Visualizing U.S. Wealth by Generation The distribution of wealth is an important measure of the economic power of each generation. In the U.S., for example, baby boomers own half of the nation’s $156 trillion in assets despite making up 21% of the country’s population. To learn more about U.S. wealth by generation, we’ve […]
John Hancock: Weekly Market Recap Week Ended August 25
Rising yields The potential for further rate hikes sent short-term U.S. Treasury bond yields higher, as the 2-year yield jumped on Friday to around 5.06%, roughly equal to a year-to-date high reached on March 8. The last time the 2-year yield remained above 5.00% for an extended period was in mid-2000. Fed’s […]
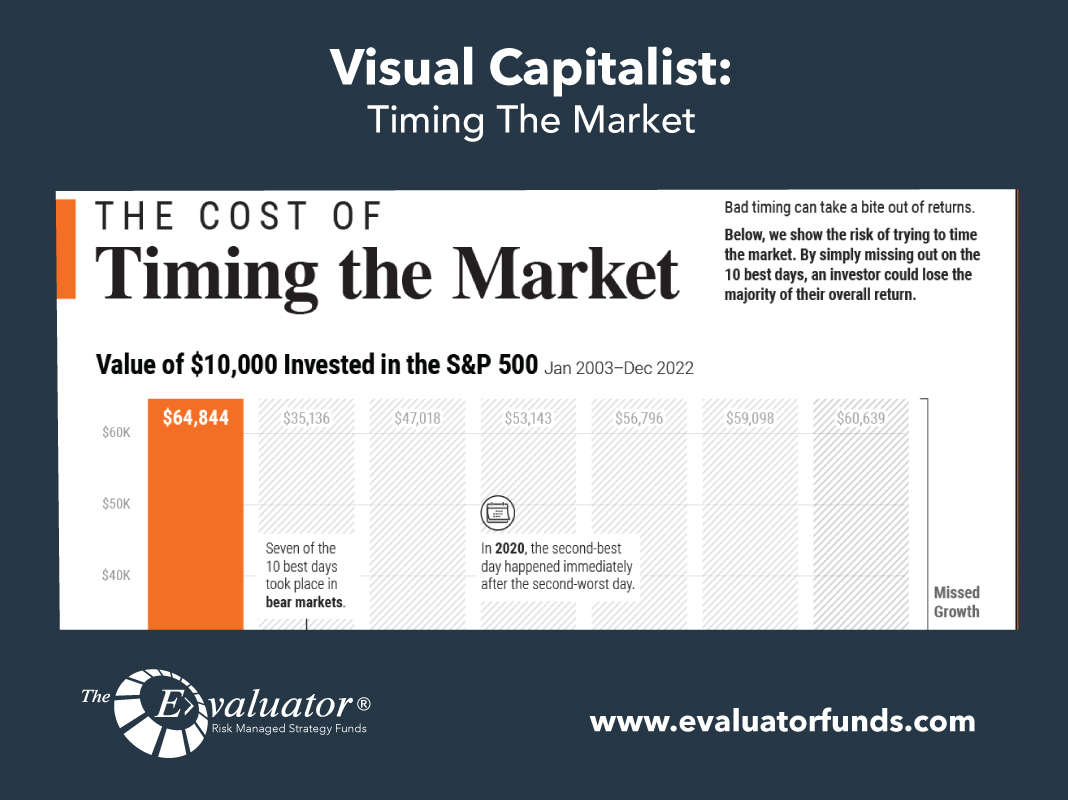
Visual Capitalist: Timing The Market
The Risks and Rewards of Timing the Market This was originally posted on Advisor Channel. Sign up to the free mailing list to get beautiful visualizations on financial markets that help advisors and their clients. Timing the market seems simple enough: buy when prices are low and sell when they’re high. But there is clear […]
John Hancock: Weekly Market Recap Week Ended August 18
Yields spike The latest U.S. Federal Reserve meeting minutes and fresh economic data bolstered expectations that interest rates are likely to remain high for longer than previously expected, and the yield of the 10-year U.S. Treasury bond on Thursday briefly eclipsed 4.32%, the highest since November 2007. Yields retreated somewhat on Friday, and the […]
LPL: Yields On The Rise-Too Much Too Fast?
Key Takeaways: Yields have moved a little too much too fast for equity markets, pushing the correlation between stocks and 10-year Treasury yields into negative territory for the first time since March. From a technical perspective, 10-year Treasury yields remain uncomfortably high as they approach resistance from the October highs. Considering stocks bottomed nearly […]
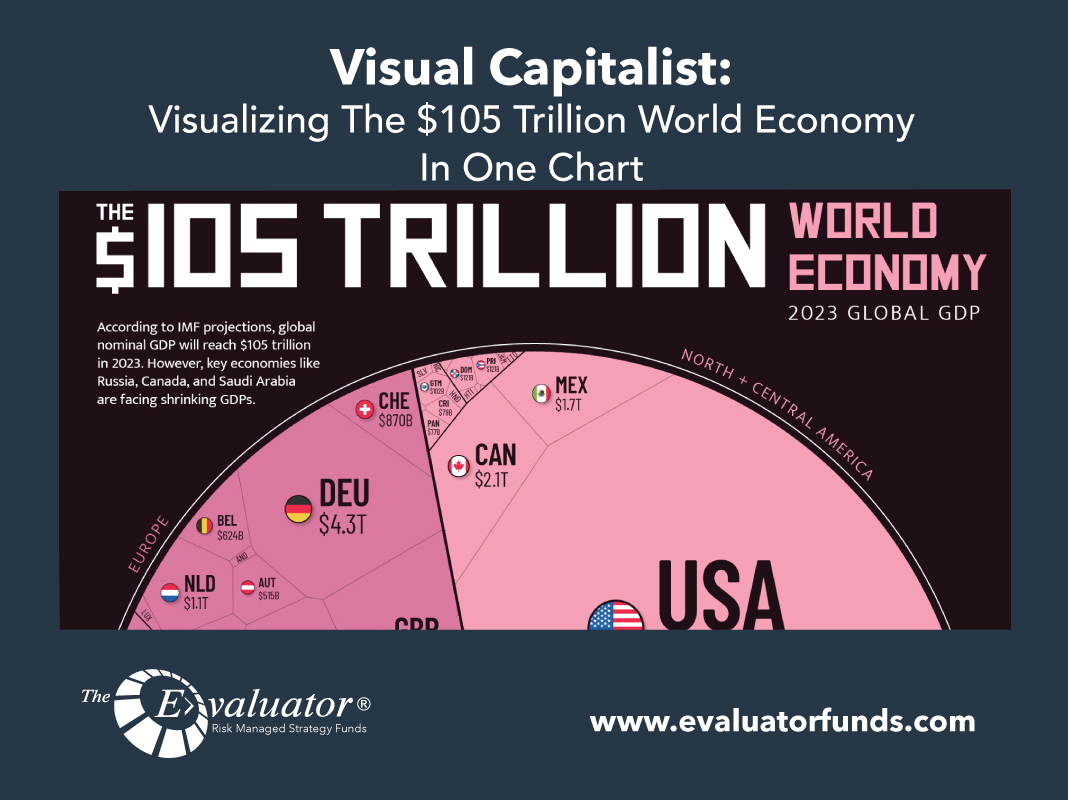
Visual Capitalist: Visualizing The $105 Trillion World Economy In One Chart
Visualizing the $105 Trillion World Economy in One Chart By the end of 2023, the world economy is expected to have a gross domestic product (GDP) of $105 trillion, or $5 trillion higher than the year before, according to the latest International Monetary Fund (IMF) projections from its 2023 World Economic Outlook report. […]
LPL: Job Growth Ever So Softer
KEY TAKEAWAYS OVERVIEW The Bureau of Labor Statistics (BLS) reported nonfarm payrolls grew by 187,000 in July, just shy of consensus. This, however, marks a slight uptick from the revised June figure of 185,000. The healthcare sector was the biggest contributor, adding 63,000 jobs, followed by social assistance (24,000) and financial activities (19,000). Labor […]
John Hancock: Weekly Market Recap Week Ended August 11
Moody’s downgrades Moody’s cut the credit rating of 10 small and midsize U.S. banks on Monday, noting it has several larger lenders under review. The move from the ratings agency reflects the challenges the banking industry still faces, including increased lending costs and dampening profitability. Inflation expectation Inflation in the United States, as measured […]
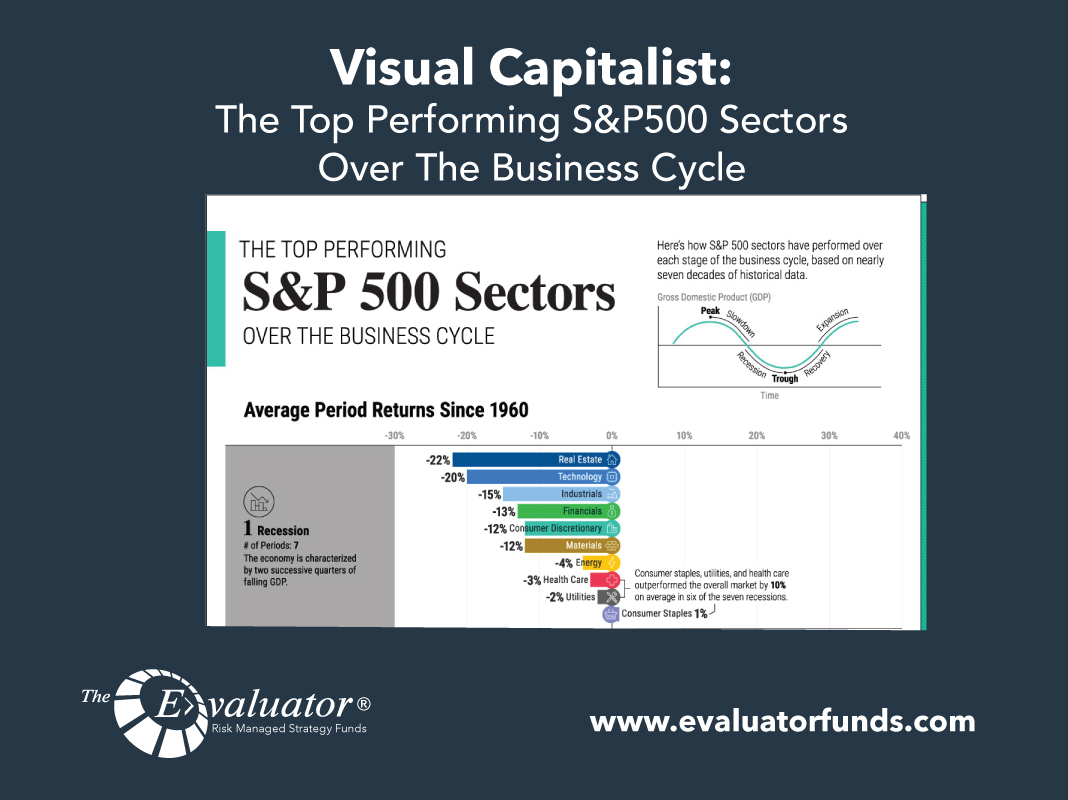
Visual Capitalist: The Top Performing S&P500 Sectors Over The Business Cycle
The Top Performing S&P 500 Sectors Over the Business Cycle This was originally posted on Advisor Channel. Sign up to the free mailing list to get beautiful visualizations on financial markets that help advisors and their clients. The business cycle fluctuates over time, from the highs of an expansion to the lows of a recession, […]
LPL: U.S. Government Debt Was Downgraded. Will It Matter?
Wednesday, August 2, 2023 Yesterday, one of the three main rating agencies (Fitch) downgraded U.S. government debt to its second highest rating, AA+. The agency cited “the expected fiscal deterioration over the next three years, a high and growing general government debt burden, and the erosion of governance relative to ‘AA’ and ‘AAA’ rated […]


